Corn is used as a feed and processing industry raw material. The content of crude fat is an important indicator of the quality and grade of feed products. At present, the crude fat in feed is generally determined according to GBY643321986. However, the current chemical analysis methods can no longer meet the requirements of agricultural production development. Especially in the field of precision agriculture, rapid, timely, and accurate methods for the diagnosis of plant nutrition have become the field of plant nutrition. Research hotspots.
Hyperspectral remote sensing is the current remote sensing technology. It refers to the use of many very narrow (typically < 10 nm) electromagnetic wave bands to obtain relevant data from objects of interest. In recent years, with the application of high-spectral resolution remote sensing technology, remote sensing can be expanded in the spectral dimension, and the quantitative analysis of the weak spectral differences of the ground objects can be directly performed, which shows a strong advantage in the research and application of vegetation remote sensing.
There have been some reports on the relationship between corn biochemical composition content and hyperspectral reflectance at home and abroad. For example, Daughtry et al. showed that there is a close relationship between the chlorophyll content of corn leaves and the spectral reflectance of leaf level and canopy level. Tan Changwei et al. The mathematical model of summer corn canopy spectral parameters establishes the prediction model of total nitrogen content and chlorophyll content, indicating that using the first-order differential spectrum and red edge position to calculate the chlorophyll content of summer corn canopy is not only feasible but also has high inversion accuracy; Cheng Yisong et al studied different The spectral characteristics of summer maize under nitrogen conditions determined the range of chlorophyll-sensitive bands during the whole growth period and at different growth stages. Graeff and Clausin et al. showed that corn nitrogen status can be diagnosed by canopy spectral reflectance. Jiang Hairong et al. Corn canopy spectra can be used to estimate the cellulose and hemicellulose content of leaves. The above studies mostly analyzed the relationship between chlorophyll and nitrogen content and spectral reflectance. There was no report on the relationship between corn crude fiber content and spectrum.
The purpose of this paper is to explore the feasibility of rapidly, simply and accurately diagnosing the crude fiber content of corn by constructing a hyperspectral model, and to provide a basis for replacing or partially replacing time-consuming and expensive phytochemical analysis methods.
1 Materials and Methods
1.1 Materials and Test Design
The maize varieties Dandan 13, Danyu 13, Suyujing 1, Suyujing 2, Tetian 1 and Chaotian 2018 were planted on the experimental farm of Zhejiang University (120°10′E, 30°14′N). The area of ​​the plot is 1125 m × 3164 m, and the row and spacing are 0135 m × 0128 m. Each plot is sown with 2 rows, about 5 m-2, with 3 repetitions for each species. In the mature period of maize, the whole plant samples were collected from different varieties of maize. Three strains were randomly selected from each plot. After sampling, they were immediately transported back to the laboratory and separated by leaves, stems, ears and leaf sheaths. Simultaneous measurement of spectral reflections in various organs was conducted. rate.
1.2 Spectrometry
Using ASD FieldSpec Pro FRTM spectrometer of American ASD (Analytical2Spectral Device), the waveband value is from 350 to 2 500 nm, among which, the spectral sampling interval (band width) of 350 to 1 000 nm is 114 nm, and the spectral resolution is 3 nm, 1 000- The 2 500 nm spectral sampling interval (band width) is 2 nm and the spectral resolution is 10 nm. Spectral reflectance was measured for different organs of corn. During the measurement, the sample was placed flat on a black rubber with a reflectance of approximately zero. The field of view of the spectrometer was 8°, the probe was vertically downward, and the distance from the sample surface was 0.10 m. The source was a 50 W halogen lamp with a spectrometer. The sample surface distance is 0.45 m and the azimuth angle (the angle between the light source and the sample surface) is 70°. Before each data acquisition, standard whiteboard corrections were performed. Spectral sampling recorded 10 spectral values ​​at a time, and average values ​​were taken as the spectral values ​​of the samples. In addition to the number of leaf sheath samples of 5, the number of remaining organs was 6 and the total number of samples was 35.
1.3 Determination of crude fat
With Soxhlet extraction, there are 35 crude fat content values ​​corresponding to the number of spectral samples. Or it can be measured with the crude fat analyzer or the SZF-06A fat analyzer. Both of these instruments can test multiple samples at one time, which greatly improves the testing efficiency.
1.4 First-order differential spectroscopy
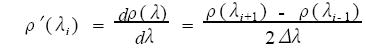
With the increase of hyperspectral data, the background and measurement environment will have more and more influence on the spectral data. Differential spectral technology will provide a powerful tool for solving such problems. Differential spectroscopy has been widely used to reduce the effects of atmospheric scattering and absorption, background, and instrument noise on the spectral characteristics of the target. The first derivative spectrum can be expressed as
,
Where Ï'(λi) is the first derivative spectrum at λi, λi is the wavelength value of band i, Ï(λi) is the spectrum value (such as reflectivity, transmittance, etc.) at wavelength λi, and Δλ is the wavelength λi - The interval from 1 to λi depends on the wavelength of the wavelength band.
1.5 Data Analysis
Use the SPSS1010 statistical analysis software package and Excel data analysis capabilities.
2 Results and Analysis
2.1 Correlation Analysis and Estimation Model of Crude Fat Content and Original Hyperspectral Reflectance
As can be seen from Figure 1, the correlation between crude fat and the original hyperspectral reflectance was extremely negatively correlated in the visible and near-infrared regions, showing a significant positive correlation around 1350 nm, and at 1 507 nm. The maximum positive correlation coefficient, r = 0.722. Taking the spectral reflectance at 1 507 nm as the independent variable and the crude fat content as the dependent variable, a linear and nonlinear regression model was established by curve fitting. The nonlinear equation contains both exponential and logarithmic forms. The exponential model in the nonlinear regression model is superior to the logarithmic model (Figure 2). As can be seen from Figure 2, the fitting effect of the index model (R2 = 015873) and crude fat content is slightly better than that of the linear model (R2 = 015212), which indicates that using the index model to predict the crude fat content is more appropriate, and its prediction accuracy remains to be determined test.
2.2 Correlation analysis and estimation model of crude fat content and first-order differential reflectance
As can be seen from Figure 3, there is no clear correlation between the content of crude fat and the first-order differential, and the correlation coefficient varies drastically with the wavelength, but there is a maximum correlation coefficient between the two at 1 954 nm, r = 0.814 showed a very significant positive correlation, which was stronger than the correlation between the original spectrum and the crude fat content. The first-order differential of reflectance at 1 954 nm was used as an independent variable, and the crude fat content was a dependent variable to establish a linear and nonlinear regression model between the two (Figure 4). It can be seen from Fig. 4 that the model constructed with the first derivative of reflectance has a better fitting effect with the crude fat content than the model constructed with the original hyperspectral reflectance; at the same time, the fitting effect of its exponential model (R2 = 016977) It is better than the linear model (R2 = 016619), which shows that the exponential model is better than the linear model in explaining the change of crude fat content. The prediction accuracy of the model remains to be tested.
3 accuracy inspection
Generally, the following accuracy evaluation criteria can be used:
(1) Correlation coefficient evaluation
Correlation coefficients between spectral data and biophysical and biochemical parameters and regression analysis can be used to evaluate the correlation between the theoretical and measured values ​​derived from the hyperspectral model and the pros and cons of the prediction results.
(2) Root Mean Square Error (RMSE) Evaluation
The parameters estimated by the univariate and multivariate regression models can be evaluated using the root mean squared error. In the formula, yi and y'i are measured values ​​and theoretical values, respectively, and n is the number of samples. The smaller the RMSE value, the higher the accuracy of the equation.
(3) Relative error evaluation
Relative error (%) = (y - y')P??y ×100% where y and ??y' represent the average of the actual and theoretical values, respectively. The smaller the relative error, the higher the accuracy of the equation. The accuracy test of the constructed model is shown in Table 1.
The analysis of Table 1 reveals that the first-order differential constructed by the index model has better accuracy indices. Compared with the original spectral reflectance, this model also has the largest correlation coefficient, the smallest relative error, and the smallest RMSE, which are calculated by this model. The correlation between theoretical and measured values ​​of crude fat content is shown in Figure 5. As can be seen from Fig. 5, there is a strong linear correlation between theoretical values ​​and measured values ​​calculated from the first-order differential exponential model, and the distribution of scattergrams is relatively uniform. Therefore, the first-order differential index model is considered to carry out crude fat content. The estimate is feasible. This conclusion has yet to be further demonstrated.
4 Conclusions and discussions
In this study, the crude fat content of different organs of corn and the corresponding spectral reflectance were used to analyze the feasibility of estimating the crude fat content of maize by hyperspectral reflectance. The following conclusions were drawn: between the crude fat content and the hyperspectral reflectance of different organs of corn. The correlation was extremely significant; by analyzing the correlation between crude fat content and reflectance and their first-order differentials, 1 507 nm and 1 954 nm were selected as the characteristic wavelengths for inverting crude fat content, and inversion equations were established. The accuracy test shows that the first derivative of reflectance is feasible for inverting the crude fat content of corn, and the correlation between the theoretical value and the measured value of the crude fat content retrieved by the model is extremely significant.
The hyperspectral data used in this test construction model is the spectral reflectance of the room. The preliminary conclusion is based on observation data of one year and one place. The number of samples is small. The universality of the constructed equation needs further verification; The relationship between content and hyperspectra based on the explanation of agronomy is also a work that needs further development in the future.
Spiral steel pipe machine for the manufacture of spiral seam welded pipe, It can produce the same diameter of pipe with different width of coil. Or It can produce the different diameter of pipe with different width of coil.
The process: uncoiler - leveler - shear welding station - disc trimmer - Milling Machine - delivery machine - pre-bent guide device - machine - both inside and outside welding equipment - sizing device - line ultrasonic testing equipment - rear axle and pipe cutting devices --- X-ray detection device - flat head chamfering machine - hydraulic press - welding station - weighing measuring - corrosion equipment - spray-standard equipment.
Rolling Machine is the key equipment of spiral pipe production, which is using a three-roll bending machine principle of continuous metal strip rolled into a spiral tube, and then single-sided welding, double-sided welding or high frequency welding spiral steel made.

Spiral Welded Tube Machine
Spiral Welded Tube Machine,Spiral Welded Pipe Mill,High Frequency Welding Tube Mill
Zhongtuo Roll Forming Machinery Co., ltd , https://www.frameforming.nl
